RENAL
PARENCHYMA THICKNESS: A RAPID ESTIMATION OF RENAL FUNCTION ON COMPUTED
TOMOGRAPHY
(
Download pdf )
DANIEL M. KAPLON, MICHAEL S. LASSER, MARK SIGMAN, GEORGE E. HALEBLIAN, GYAN PAREEK
Section of Minimally Invasive Urologic Surgery, Department of Surgery, Division of Urology, The Warren Alpert School of Medicine of Brown University, Providence, Rhode Island, USA
ABSTRACT
Purpose:
To define the relationship between renal parenchyma thickness (RPT) on
computed tomography and renal function on nuclear renography in chronically
obstructed renal units (ORUs) and to define a minimal thickness ratio
associated with adequate function.
Materials and Methods: Twenty-eight consecutive
patients undergoing both nuclear renography and CT during a six-month
period between 2004 and 2006 were included. All patients that had a diagnosis
of unilateral obstruction were included for analysis. RPT was measured
in the following manner: The parenchyma thickness at three discrete levels
of each kidney was measured using calipers on a CT workstation. The mean
of these three measurements was defined as RPT. The renal parenchyma thickness
ratio of the ORUs and non-obstructed renal unit (NORUs) was calculated
and this was compared to the observed function on Mag-3 lasix Renogram.
Results: A total of 28 patients were evaluated.
Mean parenchyma thickness was 1.82 cm and 2.25 cm in the ORUs and NORUs,
respectively. The mean relative renal function of ORUs was 39%. Linear
regression analysis comparing renogram function to RPT ratio revealed
a correlation coefficient of 0.48 (p < 0.001). The linear regression
equation was computed as Renal Function = 0.48 + 0.80 * RPT ratio. A thickness
ratio of 0.68 correlated with 20% renal function.
Conclusion: RPT on computed tomography appears
to be a powerful predictor of relative renal function in ORUs. Assessment
of RPT is a useful and readily available clinical tool for surgical decision
making (renal salvage therapy versus nephrectomy) in patients with ORUs.
Key
words: kidney; obstruction; kidney cortex; computed tomography
Int Braz J Urol. 2009; 35: 3-8
INTRODUCTION
The
most comprehensive radiographic modality for renal imaging is computed
tomography (CT). As CT technology has advanced with the development of
helical scanners, the resulting superior spatial and temporal resolution
no longer limits the role of CT to assess static anatomic parameters (1).
In recent years, multiple studies have demonstrated a clear role for utilizing
CT to assess renal perfusion and glomerular filtration rate (GFR) (2,3).
Langheinrich et al. demonstrated that GFR can be measured accurately with
triphasic CT (4). In addition, Patlak et al. developed a model for determining
tissue function based on contrast transfer between tissues; this technique
has been extrapolated to renal function in several studies (5). The information
provided by these functional studies may be useful in defining recoverability
of renal function, an important concept in assessing the viability of
an obstructed renal unit (ORU). Other investigators have also studied
anatomical details for assessing renal function with a recent report analyzing
the role of renal parenchyma thickness (RPT) on ultrasound as a predictor
of recoverability of renal function (6).
We sought to define the relationship between
RPT on computed tomography and renal function on Mag-3 Lasix renogram
in chronically obstructed renal units (ORUs) in order to define a minimal
thickness ratio associated with adequate function. Our goal was to provide
an efficient and pragmatic clinical tool for surgical decision making
in patients with chronic ORUs.
MATERIALS AND METHODS
Institutional
review board approval was obtained prior to the commencement of the study.
Fifty two consecutive patients undergoing lasix renograms between 2004
to 2006 were reviewed. From this cohort those who had a concomitant CT
scan within 6 months were extracted. Patients with bilateral hydronephrosis,
solitary kidney, and medical renal disease were excluded from review.
In addition, those patients whose history suggested acute obstruction
were excluded as well. Of this cohort, 28 patients had a diagnosis of
unilateral obstruction and were included for analysis. Mean and median
age was 49 and 48, respectively.
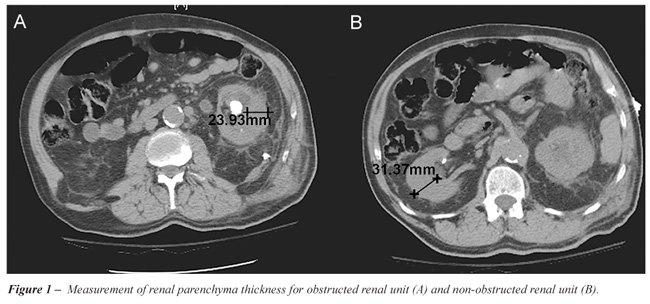
A General Electric Hi-Speed Advantage CT
scanner was used to evaluate all patients in the study. RPT was measured
at a hilar image on CT scan of the ORU and compared to a corresponding
image of the NORU (Figure-1). The parenchyma thickness at the exact cranio-caudal
midpoint of each kidney was measured using calipers on a CT workstation.
The measurement was taken at an angle exactly perpendicular to the axis
of the kidney. All measurements were performed by a single investigator.
Two additional measurements were obtained in each kidney: one 2 cm cranial
to the midpoint and one 2 cm caudal to the midpoint. For all scans, the
parenchyma was measured from the renal capsule to the edge of the collecting
system. The mean of the three measurements was then taken for each kidney
and defined as the RPT. The renal parenchyma thickness ratio of the ORUs
and non-obstructed renal unit (NORUs) was calculated and this was compared
to the observed function on Mag-3 lasix Renogram. Regression analysis
was performed using WESSA statistical software (Wessa, P. (2009), Free
Statistics Software, Office for Research Development and Education, version
1.1.23-r3, URL http://www.wessa.net/).
Correlation between RPT ratio and function
was determined. Further analysis of the linear regression curve allowed
for calculation of the RPT ratio correlating to a renal function of 20%,
which at our institution represents the general cutoff for performing
renal salvage surgery.
RESULTS
A
total of 28 patients were evaluated. Mean patient age was 49 years (range
13-90 years). Obstruction was secondary to ureteropelvic junction obstruction
(n = 12), calculus disease (n = 5), malignancy (n = 2), stricture (n =
1), ureterocele (n = 1), and non-specified hydronephrosis (n = 6). Seventeen
patients were evaluated with noncontrast CT scan and 10 patients with
contrast CT scan.
Mean parenchyma thickness was 1.82 cm and
2.25 cm in ORUs and NORUs, respectively. The mean renal function of ORUs
was 39% and the mean renal function of NORUs was 61%.
Linear regression analysis comparing renogram
function to ratio of thicknesses between the ORUs and NORUs revealed a
correlation coefficient of .48 (p < 0.001) (Figure-2). The linear regression
equation was computed as Renal Function = . 0.48 + 0.80 * RPT ratio *
RPT ratio. A thickness ratio of 0.68 correlated with 20% renal function.
COMMENTS
Computed
tomography has become a first-line assessment tool for patients presenting
with renal obstruction and has proven to be the most effective modality
for diagnosing the etiology of obstruction (7). Not only is CT widely
used, it also provides a clear depiction of the renal anatomy and may
provide additional valuable and quantifiable clinical information regarding
renal function. An important parameter assessed on CT is the “health”
of the renal parenchyma. Often in the outpatient setting RPT on CT scan
may suggest diminished renal function. When this is observed, patients
often undergo radionucleotide scans for a more formal evaluation of differential
renal function. This information then helps the clinician and the patient
make decisions about the appropriate course of treatment. Thus, our goals
were to determine if a relationship between RPT on computed tomography
and renal function on Mag-3 lasix renogram in ORUs exists and if so, to
define a minimal thickness ratio associated with adequate function.
Recently, many studies have examined various
parameters on CT in order to predict renal function. Evidence has shown
the differential renal parenchyma volume measured by noncontrast CT provides
a fairly accurate prediction of differential creatinine clearance (7).
El-Dein et al. demonstrated that contrast enhanced spiral CT is as accurate
as nuclear renography for calculating total and separate renal function
(8). There are, however, major drawbacks to these forms of renal function
estimation. Primarily, these studies required sophisticated software to
calculate total renal volume based on CT reconstructions (8). Such scans
must be performed as a dedicated study as data from existing scans may
not be adequate for the sophisticated reconstructions and volume rendering
required. In instances where reconstruction can be performed on existing
scans, it is often a time consuming and costly endeavor. Measurement of
RPT ratios, however, can be performed in a retrospective manner on existing
scans, either with or without contrast.
Multiple recent studies have demonstrated
the ability to calculate GFR using contrast enhanced CT. Most of these
studies rely on a variation of the Patlak model, which involves using
the transfer of contrast into tissue as a marker for function (5). While
this method has been validated and provides an estimate of GFR, its practical
use is limited by the complexity of calculation required to arrive at
the GFR value. In addition, Hackstein has suggested that the Patlak model
can overestimate GFR in several situations (3).
In patients with asymmetric renal disease
such as renal artery stenosis and obstruction, measurement of unilateral
function is not possible by calculation of global creatinine or inulin
clearance because these parameters are influenced by the contralateral
renal unit (1). Determination of individual kidney function has been historically
performed either by percutaneous nephrostomy and creatinine clearance
or by nuclear scintigraphy. Both of these modalities have limitations,
with the former being invasive and the latter being often unreliable in
cases of obstruction (9). More sophisticated models for predicting unilateral
renal function include electron beam CT, three-dimensional ultrasound,
and gadolinium magnetic resonance (1).
The major limitation of this study is that
the nuclear renogram is used as the gold-standard test for function. We
chose the nuclear renogram because it is the most commonly used test for
function of ORUs at most institutions, including our own. It is important
to realize, however, that nuclear renogram can actually overestimate function
in cases of obstruction (9). A more accurate assessment of renal function
could be assessed via a percutaneous nephrostomy with subsequent creatinine
clearance, but this was not possible due to the retrospective nature of
this study. In addition, the population studied here is small. Admittedly,
only 3 patients in our series had renal function less than 20% by renogram,
so a larger population will be needed to further validate these results.
In addition, it must be noted that patients with abnormalities of the
measured area of the kidney such as focal scarring or fetal lobulation
would not be good candidates for this method of measurement.
To date, no study has used parenchyma thickness
alone to compare function to nuclear renography. We assessed a group of
patients in whom all had a chronic unilateral abnormality and a presumed
normal contralateral renal unit. This study describes an approach that
allows for rapid estimation of renal function using a single measurement,
which can be done without sophisticated reconstructions. The thickness
ratio of the ORU to NORU correlates quite well with the relative function
as predicted by nuclear renogram.
CONCLUSION
Renal parenchyma thickness ratio on computed tomography appears to be a powerful predictor of relative renal function in chronic ORUs. Assessment of RPT ratio is a useful clinical tool for surgical decision making in patients with ORUs. It relies on straight-forward measurements that can be made on existing CT scans without the need for complex calculations, reconstructions, or secondary studies.
CONFLICT OF INTEREST
None declared.
REFERENCES
- Daghini E, Juillard L, Haas JA, Krier JD, Romero JC, Lerman LO: Comparison of mathematic models for assessment of glomerular filtration rate with electron-beam CT in pigs. Radiology. 2007; 242: 417-24.
- O’Dell-Anderson KJ, Twardock R, Grimm JB, Grimm KA, Constable PD: Determination of glomerular filtration rate in dogs using contrast-enhanced computed tomography. Vet Radiol Ultrasound. 2006; 47: 127-35.
- Hackstein N, Bauer J, Hauck EW, Ludwig M, Krämer HJ, Rau WS: Measuring single-kidney glomerular filtration rate on single-detector helical CT using a two-point Patlak plot technique in patients with increased interstitial space. AJR Am J Roentgenol. 2003; 181: 147-56.
- Hackstein N, Wiegand C, Rau WS, Langheinrich AC: Glomerular filtration rate measured by using triphasic helical CT with a two-point Patlak plot technique. Radiology. 2004; 230: 221-6.
- Patlak CS, Blasberg RG, Fenstermacher JD: Graphical evaluation of blood-to-brain transfer constants from multiple-time uptake data. J Cereb Blood Flow Metab. 1983; 3: 1-7.
- Khalaf IM, Shokeir AA, El-Gyoushi FI, Amr HS, Amin MM: Recoverability of renal function after treatment of adult patients with unilateral obstructive uropathy and normal contralateral kidney: a prospective study. Urology. 2004; 64: 664-8.
- Ng CF, Chan LW, Wong KT, Cheng CW, Yu SC, Wong WS: Prediction of differential creatinine clearance in chronically obstructed kidneys by non-contrast helical computerized tomography. Int Braz J Urol. 2004; 30: 102-7; discussion 108.
- El-Ghar ME, Shokeir AA, El-Diasty TA, Refaie HF, Gad HM, El-Dein AB: Contrast enhanced spiral computerized tomography in patients with chronic obstructive uropathy and normal serum creatinine: a single session for anatomical and functional assessment. J Urol. 2004; 172: 985-8.
- Steckler RE, McLorie GA, Jayanthi VR, Gilday DL, Ash JM, Churchill BM, et al.: Contradictory supranormal differential renal function during nuclear renographic investigation of hydroureteronephrosis. J Urol. 1994; 152: 600-2; discussion 602-3.
____________________
Accepted after revision:
October 2, 2008
_______________________
Correspondence address:
Dr. Daniel M. Kaplon
Dept. of Surgery/Division of Urology
Rhode Island Hospital
2 Dudley Street, Suite 174
Providence, 02905, RI, USA
Fax: + 1 401 444-6947
E-mail: kaplonda@gmail.com
EDITORIAL COMMENT
Non-invasive
estimation of split renal function has been a major challenge for many
years, since renal scintigraphy has some limitations (including overestimation
of function in obstructive diseases). Helical Computed Tomography (CT),
which is considered the most important, self-comprehensive imaging study
for renal evaluation, has previously been used to predict split renal
function, based on morphological and perfusional criteria (1). However,
most of the models require the injection of iodinated contrast media,
which may be a significant limitation in patients with impaired renal
function (given the nephrotoxicity of the contrast agent). Even contrast-enhanced
Magnetic Resonance Imaging (MRI), formerly considered a safe method for
renal function estimation in patients with impaired renal function, has
become a limited exam in this scenario given the apparent association
of gadolinium injection and the development of nephrogenic systemic fibrosis
in this group of patients.
Summerlin et al. recently published an article
showing that split renal function can be correctly calculated using 3D
renal volumes obtained on CT images, with good correlation to the results
of split post-contrast renal attenuation and renal scintigraphy (2). The
article from Dr. Kaplon et al. proposes a practical and straightforward
method of calculating split renal function based solely on renal parenchyma
thickness, regardless of the use of intravenous contrast media. Given
the simple measurements technique, and since it does not involve complicated
mathematical models for analysis, it is intuitive to predict that the
method could be extrapolated to other imaging techniques, such as ultrasound
and non-enhanced MRI, and further investigations will certainly be conducted
on these new possibilities.
REFERENCES
- Hackstein N, Buch T, Rau WS, Weimer R, Klett R: Split renal function measured by triphasic helical CT. Eur J Radiol. 2007; 61: 303-9.
- Summerlin AL, Lockhart ME, Strang AM, Kolettis PN, Fineberg NS, Smith JK: Determination of split renal function by 3D reconstruction of CT angiograms: a comparison with gamma camera renography. AJR Am J Roentgenol. 2008; 191: 1552-8.
Dr.
Ronaldo Hueb Baroni
Institute of Radiology
University of Sao Paulo, USP
Sao Paulo, SP, Brazil
E-mail: rbaroni@einstein.br